Emerging markets are dependent on global fund flows, and the currency that flows the most is the dollar.
Key Points
- EM economies and the EM equity asset class are dependent on external capital flows which means US dollar capital flows
- Emerging market equities tend to do very well in a weak dollar environment but struggle in a strong-dollar environment.1
- It is the savings-deficient economies with current account deficits that are most sensitive to capital flows
- We may have seen a peak in the US dollar in October 2022, which would suggest the potential for a good year for EM equity in 2023 (and beyond)
At the start of 2023, after a rough 2021 and 2022 for emerging market equities, we wanted to revisit what we consider to be a key (possibly the key) driver for the asset class: the direction of the US and the capital flows that result from that.
As a whole, EM economies and the EM equity asset class are dependent on external capital flows. Economies more driven by domestic demand require capital inflows to finance current account deficits, while the economies with stronger export bases tend to have significant exposure to demand from emerging markets (e.g. Korean car companies sales in India) as well as having dependency on foreign financing of corporate investment.
As we have noted before, when we talk about capital flows, we mean US dollar capital flows. Mark Carney, then Governor of the Bank of England, summarized this well in 2019, noting that the dollar represents the currency of choice for at least half of international trade invoices (around five times greater than the US’s share in world goods imports and three times its share in world exports). He went on “given the widespread dominance of the dollar in cross border claims, it is not surprising that developments in the US economy, by affecting the dollar exchange rate, can have large spillover effects to the rest of the world via asset markets… the global financial cycle is a dollar cycle.”
When dollars are being sold to realize outbound capital flows, the dollar tends to weaken, and when dollars are being repatriated, the dollar tends to strengthen. Thus, an easy proxy for global dollar liquidity is the dollar exchange rate (or, rather, all the dollar exchange rates, which can be measured by the broad, trade-weighted US dollar real effective exchange rate).
The US dollar has, since the rise of emerging markets as an asset class, moved in large, multi-year cycles. Starting in 1989, the dollar weakened until mid-1995, by which point eighteen-months of US interest rate hikes started to drive a stronger dollar (as well as a series of devastating economic crises in the emerging world). This up-cycle lasted until early-2002, by which point the interest rate cuts after the dot-com boom had turned to bust started to weaken the dollar.
Long-term volatility of the trade-weighted dollar exchange rate
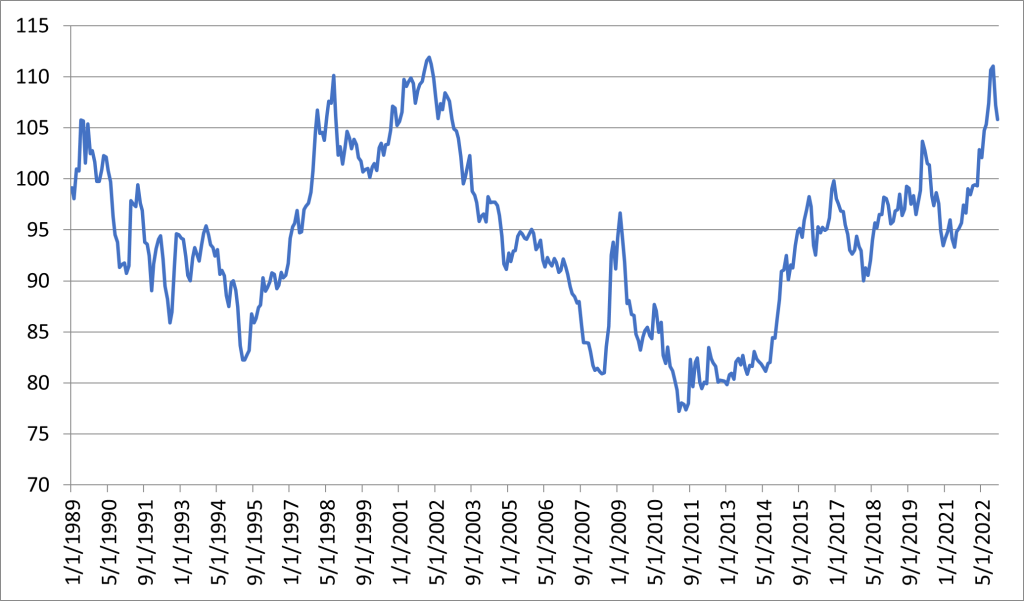
Despite some volatility around the Great Financial Crisis, the dollar remained in its broad downtrend until mid-2011, when the prospect of an end to the post-GFC quantitative easing started an upward move in the dollar which we still be in (more on this later).
In 2019 we wrote about the importance of understanding the outsize impact of the US dollar environment on emerging market equity returns. We wanted, post-COVID and the recent inflation spike, to provide an update to this work.
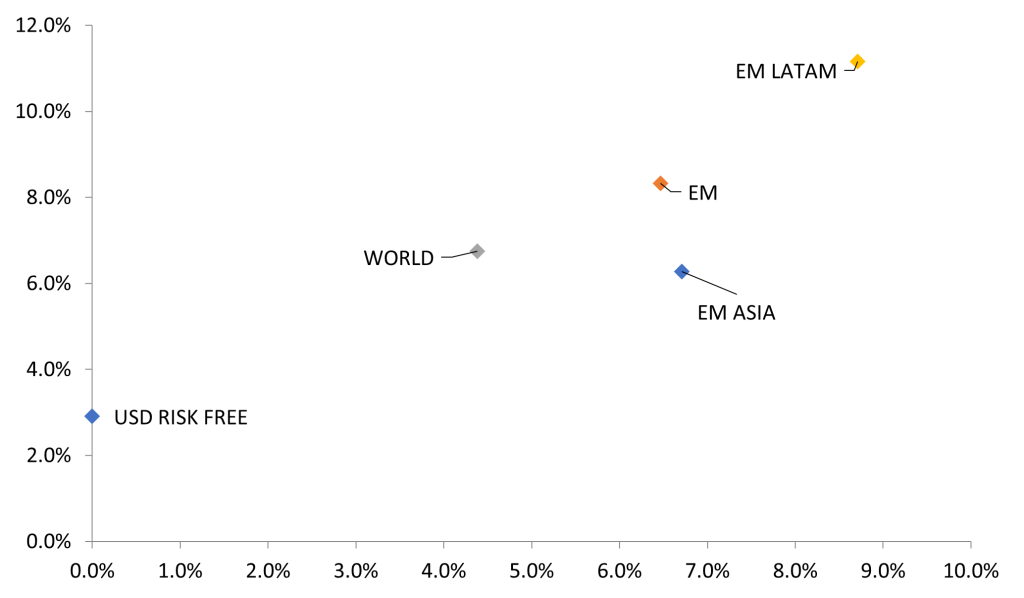
Starting in 1989, which is about as far back as we can go (and with the caveat that we have had to estimate the dividend component of total return indices for the period 1989-1999), we can see that US Fed Funds (which is the global risk-free rate), has averaged 2.9%. Equity investors buying developed market equities, as measured by MSCI World Index, have enjoyed a return pick-up to an annualized return of 6.7%, to compensate for a volatility in monthly returns of 4.4%. Those investors who invest in emerging market equities, as measured by MSCI EM Index, have enjoyed a further return pick-up to an annualized return of 8.3%, to compensate for a higher volatility in monthly returns of 6.5%. This is good Modern Portfolio Theory stuff, in line with Harry Markowitz’s original model.
Higher risk has brought higher returns
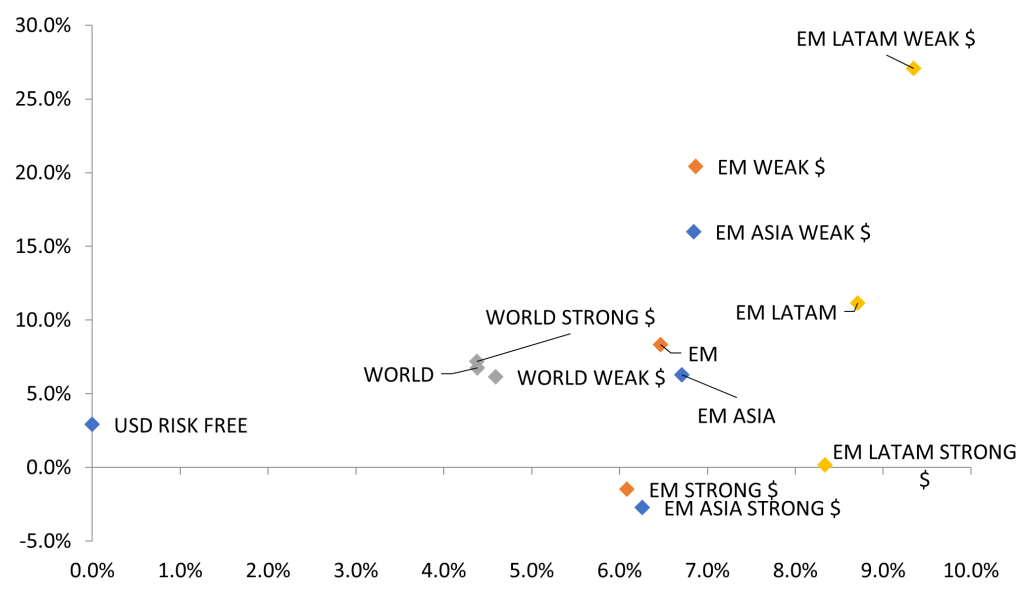
What this long period doesn’t capture, is the way that these returns change during strong- and weak-dollar environments. Splitting those out (as described above) shows that the long-term average contains two very different groups of returns.
When the dollar is strong, the risk and return metrics of developed markets don’t change very much – the weight of the US in the asset class causes the slightest improvement – and there is a corresponding slight worsening in a weak dollar world.
Emerging markets are different. In a weak dollar environment (as measured over 185 months), the average USD annualized return of EM equity is 20.4% with only a small increase in volatility to 6.9%. Meanwhile, in strong dollar environments the average annualized USD return is -1.5%. Essentially, over the last thirty-three years, all the long-term gains in EM have been made in weak dollar environments.
The dollar exchange rate drives EM returns
Looking beyond that fact, it is interesting to consider which types of emerging market do best. We believe that investors can think of emerging markets as existing on a spectrum from high-savings rate/current account surplus/net saver export economies (Korea, Taiwan, the Gulf States) through to low-savings rate/current account deficit/net borrower economies with more of a dependence on domestic demand (South Africa, India, Turkey, Brazil, Egypt). As this is a spectrum, there is a group of countries with some characteristics of both ends, such as Indonesia, Malaysia and Chile. There are also country-specific conditions that change a country’s characteristics (Mexico’s large remittances from overseas citizens offset the tendency to run a current account deficit.
In the above analysis, Latin American markets have tended to perform especially well in weak USD environments, but it is important to focus more on characteristics than individual markets. The key characteristics of Latin America in this period have been weak domestic savings and current account deficits, which create the outsize sensitivity to capital flows. Historically, markets with these features have tended to be weak-dollar winners and strong-dollar losers, but these are not fixed identities – Thailand and South Korea ran current-account deficits in the 1990s when they collapsed into crisis with a strong dollar, but now both run large surpluses and are net savers.
Where are we now? The US dollar has been significantly weak in the last two months, suggesting a peak was reached in October 2022. To be clear, there have been previous short-term peaks and troughs in the dollar during broad upswings and downswings (for example in March 2020 during the initial onset of COVID-19, after which the dollar weakened but remained in its uptrend). But, if the dollar has topped out (at a level similar to the top in 2002), and 2023 and beyond are to be weak-dollar years, then investors need to bear in mind the highly-positive implications for EM equity and for the more capital-sensitive markets within that asset class.
Source for all data JOHCM/Bloomberg (unless otherwise stated)
An investor should consider the Fund’s investment objectives, risks, and charges and expenses carefully before investing or sending any money. This and other important information about the Fund can be found in the Fund’s prospectus or summary prospectus, which can be obtained at www.johcm.com or by calling 866-260-9549 or 312-557-5913. Please read the prospectus or summary prospectus carefully before investing. The JOHCM Funds are advised by JOHCM (USA) Inc. and distributed through JOHCM Funds Distributors, LLC. The JOHCM Funds are not FDIC-insured, may lose value, and have no bank guarantee.
Past performance is no guarantee of future results.
RISK CONSIDERATIONS:
The Fund invests in international and emerging markets. International investments involve special risks, including currency fluctuation, lower liquidity, different accounting methods and economic and political systems, and higher transaction costs. These risks typically are greater in emerging markets. Such risks include new and rapidly changing political and economic structures, which may cause instability; underdeveloped securities markets; and higher likelihood of high levels of inflation, deflation or currency devaluations.
The views expressed are those of the portfolio manager as of January, 2023 are subject to change, and may differ from the views of other portfolio managers or the firm as a whole. These opinions are not intended to be a forecast of future events, a guarantee of future results, or investment advice.
2303026 – 2a